
As we read in our previous blog on Scalability, the amusement park was designed with scalability in mind. It was built with modern, scalable architecture (microservices architecture). Every ride, food stall, and ticket booth was designed to handle traffic spikes effortlessly.
But then, something strange happened.
One Christmas, as thousands of visitors arrived, some guests, while scanning their membership cards, received an error:
❌ “System Unavailable. Please try again.”
The rides were running. The food stalls were open. The amusement park was in its full swing—but for these unlucky guests getting membership card errors.
🔍 The Mystery of the Failing System
Alex, the amusement park’s chief engineer, rushed to investigate. Initially, everything looked fine:
✅ The rides were operational.
✅ The ticketing system was up.
✅ Payments were going through.
Yet these guests’ membership cards are not working.
Scratching his head, Alex turned to Mr. Kohli, the park’s chief architect.
With a smile, Mr. Kohli said,
“Scalability ensures you can handle more guests. High availability ensures no guest gets left out.”
With that, Alex, the park’s chief engineer, realized what was wrong. It wasn’t about handling more visitors. It was about ensuring the park never failed.
❓What Was Happening?
As Alex dug deeper into the logs, he found some patterns:
🚧 Single Point of Failure (SPOF): The authentication service was running on only one instance. When it was overloaded, it started failing.
💳 External Dependencies: The payment gateway relied on a third-party API. If that API had a delay, transactions failed for some users while succeeding for others.
🔄 Uneven Load Distribution: The load balancer wasn’t working optimally, so some servers were overloaded while others were idle. This means the entry issue was with some guests, while others could enter the amusement parks seamlessly.
The amusement park wasn’t fully down—but it was not available to all the visitors.
That’s the real danger of low availability. Your system seems fine from the outside, but inside, it is not.
🚀 What Is High Availability?
When a system has high availability (HA), it remains functional even when there are problems. It guarantees uninterrupted service access for users and reduces downtime.
In simpler terms, TechnoPark’s goal wasn’t just to handle more visitors—it was to ensure that no matter when a guest arrived, they could enjoy themselves without issues.
As per Wikipedia
High availability (HA) is a characteristic of a system that aims to ensure an agreed level of operational performance, usually uptime, for a higher than normal period.
⚖️ How is High Availability Different from Fault Tolerance?
Though they sound similar, high availability and fault tolerance are not the same.
| 🛠️ Feature | ⚡ High Availability | 🏆 Fault Tolerance |
|---|---|---|
| 🎯 Goal | Minimize downtime. | Ensure zero disruption. |
| 🔍 Handling Failures | Detect and recover quickly. | Continue operation instantly. |
| 🎢 Example | If one park entry gate is down, visitors are redirected to another open gate. They may have to walk a little, but they can still enter. | Each entry gate has a duplicate system, so even if one fails, the backup immediately takes over without visitors noticing any issue. |
📝 In simple words:
⚡High Availability is like having multiple park entry gates—if one gate fails, visitors can still enter through another, even if it’s a bit inconvenient.
🏆 Fault Tolerance is like having self-repairing gates—if a gate fails, it instantly switches to a backup without any visitor noticing.
We’ll explore fault tolerance in more detail in an upcoming blog. Stay tuned!
🏗️ Strategies to Achieve High Availability
To ensure the amusement park is always open, Mr. Kohli and Alex, the engineer, implemented different high-availability strategies for Alex.
🔄 Redundancy: No Single Point of Failure (SPOF)
The park has multiple ticket booths, food stalls, and power generators. If one breaks down, others are available to keep things running smoothly.
In the digital world, redundancy means replicating critical components (servers, databases, APIs) so that backups are always available.
✅ Advantages
✔ Eliminates single points of failure.
✔Provides a seamless user experience.
⚠️ Challenges
❌ Increases infrastructure cost (more servers needed).
❌ Keeping all replicas synchronized can be complex.
⚖️ Load Balancing: Distributing Traffic Efficiently
Imagine in the amusement park, there are ten entry gates. What if one failed to operate? Then the visitors can be redirected to another gate to ensure no one is stuck for entry.
In the digital world, Load balancers distribute incoming requests across multiple servers so no single server gets all the requests. If one server fails, traffic is rerouted to healthy ones.
✅ Advantages
✔ Prevents a single failure point from affecting users.
✔ Improves response time by balancing the load.
✔Prevents server overloads.
✔ Supports auto-scaling (adding/removing servers dynamically).
⚠️ Challenges
❌ Needs careful configuration to avoid bottlenecks.
❌ If the load balancer itself fails, the entire system can be impacted (unless redundant).
📈 Auto-Scaling: Expanding on Demand
On weekends, more people visit, so the park opens more entry gates and adds extra ticket booths. On slower weekdays, fewer gates operate to optimize resources.
Similarly, in the digital world, auto-scaling service instances can be added or removed based on traffic.
✅ Advantages
✔ Prevents system overload before it happens.
✔ Saves money—scales only when needed.
✔ Ensures consistent performance during traffic spikes.
⚠️ Challenges
❌ Takes some time to spin up new instances (not instant).
❌ Requires fine-tuning to avoid scaling too late or too early.
❤️🩹 Failover Mechanisms: Instant Recovery
The amusement park’s payment system relied on a single third-party API. When that API was slow, payments failed.
They implemented a failover mechanism that automatically switched to a backup payment provider if the primary one failed. In the digital world, this is common in database replication and cloud infrastructure.
✅ Advantages
✔ Ensures minimal downtime when a failure occurs.
✔ Automated switching reduces manual intervention.
⚠️ Challenges
❌ Requires extra setup (configuring backups and monitoring).
❌ Some failover switches may introduce delays (checking if the primary service is down).
🗺️ Geographic Distribution: Expanding Across Locations
To prevent complete shutdowns due to disasters, TechnoPark has multiple locations in different cities. If one park closes due to bad weather, guests can visit another.
In the digital world, applications get deployed across multiple geographic locations. If one region faces an outage, traffic is rerouted to another region.
✅ Advantages
✔ Protects against data center failures and natural disasters.
✔ Reduces latency by serving users from the nearest location.
⚠️ Challenges
❌ Requires complex synchronization between regions.
❌ More expensive—requires additional cloud resources.
Now Alex understood how to achieve high availability, but still, he knew, “If you can’t measure it, you can’t improve it.”
“How do we know if our system is highly available?” Mr. Kohli replied, “We measure it.”
⏳ The Magic of the ‘Nines’ – Availability Percentage
High availability is typically measured by uptime percentage, often expressed in nines (9s).
Mr. Kohli explained that if your amusement park availability is 99.99%, you can only afford around 52 minutes of closure (or downtime) throughout the year. If you target 99.999%, then the closure (or downtime) is what you can afford.
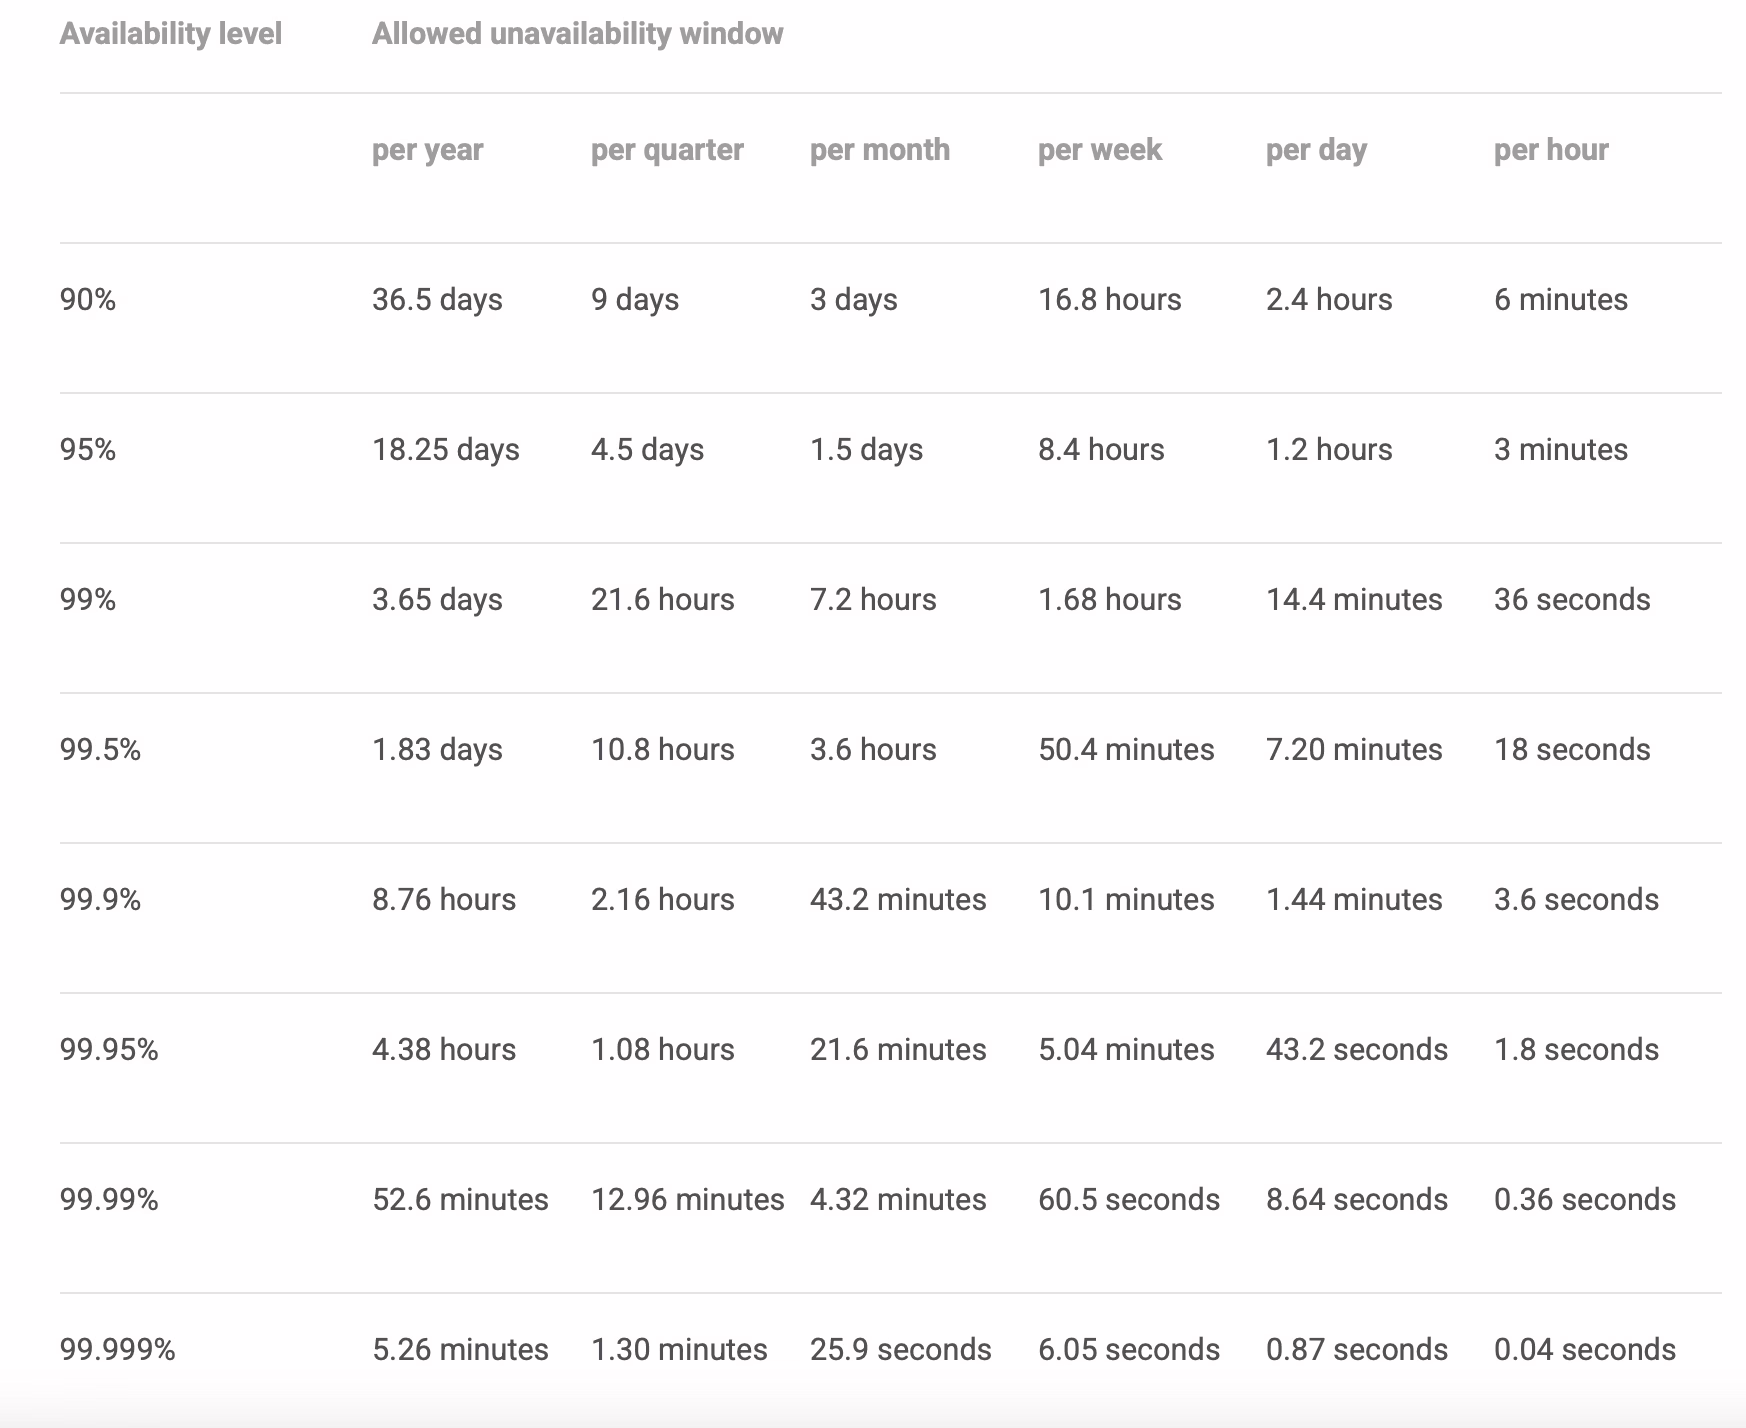
Source: https://sre.google/sre-book/availability-table/
Alex’s eyes widened. “Wow! That means even a few minutes of system failure can break our high availability goal.” But how do we measure High Availability?
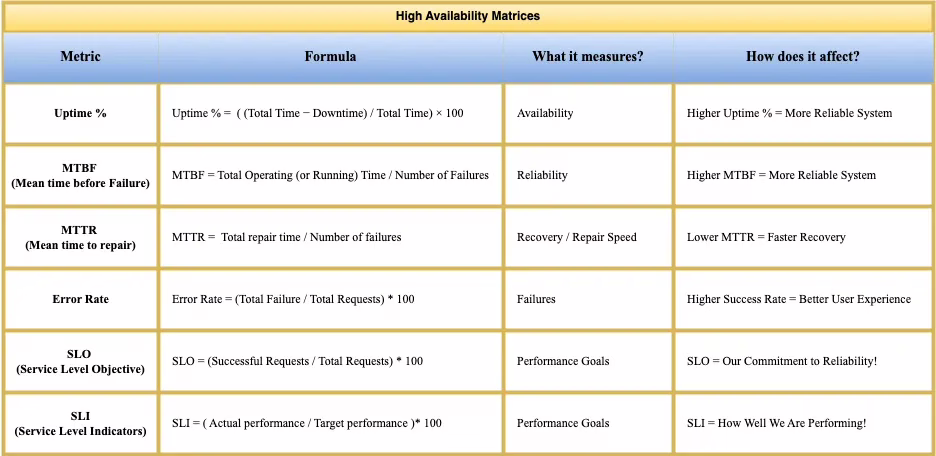
📊 Key Metrics for Measuring High Availability
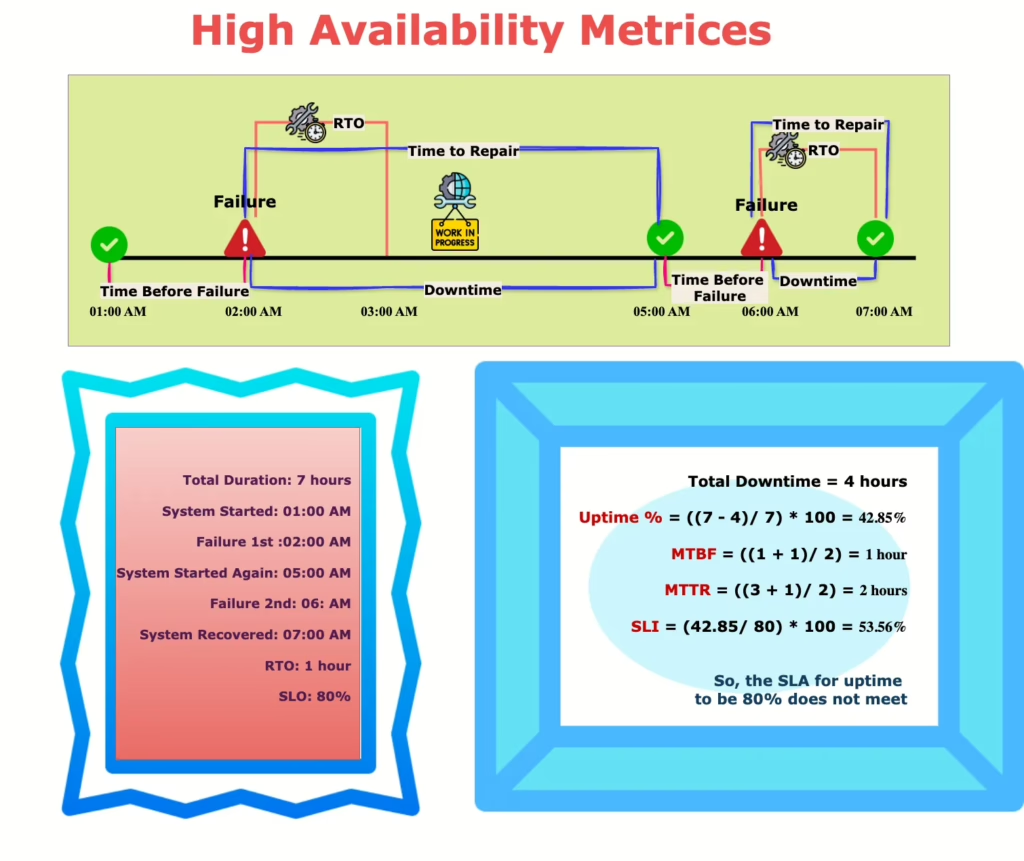
🏗️ Uptime Percentage (%) – How often is TechnoPark open?
Uptime % measures how much time a system is available without failure. Higher uptime means fewer disruptions!
Uptime % = ( (Total Time − Downtime) / Total Time) × 100If the amusement park is open 365 days a year and has to close unexpectedly for 3 days, its uptime would be:
Uptime % = ( (365 days – 3 days) / 365 days) * 100 = 99.17%
So, Uptime = 99.17%
A 99.99% uptime guarantee means TechnoPark can have only 52 minutes of downtime per year!
In the software world, the uptime is measured in minutes or seconds.
For example, if an e-commerce website is supposed to run 24/7 (which is 525,600 minutes in a year) but goes down for 60 minutes, we calculate the following:
Uptime % = ( (525,600 − 60) / 525,600) × 100 = 99.99%
This means the website was available for 99.99% of the year, with only one hour of downtime!
Engineers monitor uptime using health checks, logging, and monitoring tools like Dynatrace.
📝 Higher Uptime % = More Reliable System.
✅ Advantages
✔ Simple to Understand: Uptime percentage is one of the most simple metrics that is easy to calculate and understand with both technical and non-technical stakeholders.
✔ Benchmarking: You can set a clear goal for your service availability and can track its performance.
⚠️ Challenges
❌ Doesn’t Measure the Impact: The quality of service is not measured by Uptime %. It only tells you whether the service was online or in the office. A system may be up with a very high response time.
❌ Ignores Partial Failures: Partial failure in the service can also not be calculated using Uptime %. The entry gate service is scanning the normal tickets, but membership cards are failing.
🔁 2. Mean Time Between Failures (MTBF) – How long does TechnoPark run smoothly before breaking down?
MTBF measures the average time a system runs before failing. The higher the MTBF, the fewer the system breaks.
MTBF = Total Operating (or Running) Time / Number of FailuresIf at the amusement park, two rides failed in a year. One after 100 days and another after 200 days. Then, the mean time between failures would be
Total Running Time = 100 days (1st Ride) + 200 days (2nd Ride)
Number of Failures = 2 (1 in 100 days and the other in 200 days)
So, MTBF = (100 + 200) / 2 = 150 days.
A higher MTBF means TechnoPark’s rides are reliable.
For a microservice, MTBF measures how long a service runs before crashing.
If a database fails twice a year, after 3 months and 9 months, then its MTBF will be:
MTBF = (3 + 9)/2 = 6 months.
📝 Higher MTBF = More Reliable System.
✅ Advantages
✔Predictive Insight: MTBF helps predict how often the service is failing. This way, you can predict and take corrective actions.
✔Reliability Focus: It helps identify the services that fail frequently and need improvement.
⚠️ Challenges
❌ Doesn’t Account for Severity: MTBF does not say anything about the severity or impact of failure.
❌ Requires Large Data Sets: To do predictions using MTBF, you need a large amount of failure data over some time.
🔧 3. Mean Time to Repair (MTTR) – How quickly can we fix a broken ride?
MTTR measures how quickly a system recovers from failure. The lower the MTTR, the faster the recovery.
MTTR = Total repair time / Number of failures
In the amusement park if a ride breaks down 3 times, and repairs take 2 hours, 3 hours, and 1 hour, then:
MTTR = (2 + 3 + 1) / 3 = 2 hours
For microservices, MTTR measures how fast the recovery from failure is.
If a server crashes 4 times and repairs take 10 min, 15 min, 20 min, and 5 min:
MTTR = (10 + 15 + 20 + 5) / 4 = 12.5 minutes
With automated failover, the switchover time dropped to under 10 seconds.
MTTR is reduced by using automated deployments, rollback mechanisms, and proactive monitoring.
📝 Lower MTTR = Faster Recovery.
✅ Advantage
✔ Shows System Responsiveness: Helps monitor the system recovery time.
✔ Improvement Indicator: This also indicates how good your system (or service) recovery is and what improvements you need in your recovery strategies.
⚠️ Challenges
❌ Doesn’t Indicate Root Cause: The root cause can’t be identified using MTTR it only tells you the recovery speed.
❌ Varies Based on Incident Complexity: Because it doesn’t tell you the root cause, some issues might take longer to debug and fix due to their complexity.
🚨 4. Error Rate – How often do tickets fail at TechnoPark?
Error rate measures the percentage of failed requests. High availability isn’t just about avoiding failures. It’s also about ensuring each request succeeds.
Error Rate = (Total Failure / Total Requests) * 100
If 10,000 guests scan their membership card and 50 fail the error rate is:
Error Rate = (50 / 10000) * 100 = 0.5%
In microservices, if an authentication service receives 1 million requests per day but 5000 fail, the error rate is 0.5%.
Engineers reduce error rates using better exception handling, retries, and monitoring tools.
📝 Higher Success Rate = Better User Experience.
✅ Advantage
✔ Immediate Insight into Issues: The error rate calculation allows monitoring tools like Dynatrace to send alerts to the support team to immediately look into the issue and fix it. So, the business can run smoothly.
✔ Customer Experience Focus: This has a direct impact on customer satisfaction score. A high rate leads to a bad user experience.
⚠️ Challenges
❌ Doesn’t Specify the Cause: This also doesn’t specify what caused the error (failure).
❌ Can Be Volatile: AA single misconfiguration can spike the error rate, making it necessary to handle short-term fluctuations.
🎯 5. Service Level Objectives (SLO) – Our promise to visitors!
SLO is a target goal for an SLI.
SLO = (Successful Requests / Total Requests) * 100
At the amusement park entry gate, the entry tickets must be scanned in less than a second.
If the amusement park was visited by 100,000 guests and it was able to scan only 99,990 guests within 1 second, its SLO would be:
SLO = ( 99,990 /1,00,000 ) * 100 =99.99%
So, SLO = 99.99%
In digital world,
A payment service might have an SLO like:
- API success rate > 99.9%
- Response time < 200ms
📝 SLO = Our Commitment to Reliability!
✅ Advantage
✔ Measurable Impact: Setting clear goals helps engineering and support teams understand what performance they need to achieve or look for.
✔ Early Warning: By monitoring SLOs, the team can identify issues before they become a disaster.
⚠️ Challenges
❌ Hard to Achieve for Complex Systems: As systems become more complex, meeting SLOs for every component becomes harder.
❌ Resource Intensive: Monitoring and managing SLOs can be resource-intensive, requiring dedicated tools and expertise.
📊 6. Service Level Indicators (SLI) – How well are we keeping our promise?
A Service Level Indicator (SLI) is a measurable performance metric that shows how well a service is performing compared to its target. It helps answer:
- Are we meeting the service quality we promised?
- How often are users experiencing failures?
- Is our system meeting customer expectations?
Think of it as a report card for your service! SLI helps measure the system’s performance in real-time.
SLI = ( Actual performance / Target performance )* 100
The amusement park promises that 99.9% of ticket scans will be successful.
📌 In one year, 1 million visitors scanned their tickets.
📌 9,97,000 scans succeed, but 3,000 fail due to technical issues.
SLI = ( 9,97,000 / 10,00,000 ) * 100 = 99.7%
💡 The amusement park promised 99.9% but achieved 99.7%, so they need improvements!
In the digital world, if a Google Alloy DB SLA has 99.99% uptime but, due to technical glitches, it provided only 99.97%, that means they missed their targets and need to relook for improvements.
SLIs in software systems include:
- API success rate
- Latency (Response Time)
- Throughput (Requests per second)
- Uptime
📝 SLI = How Well We Are Performing!
✅ Advantage
✔ Data-Driven Decision Making: Tracking SLIs can help teams identify areas of improvement and allow them to make data-driven decisions to enhance system performance.
✔Improved Communication: Both technical as well as non-technical stakeholders can discuss service performance using a common language provided by SLI.
⚠️ Challenges
❌ Maintaining SLIs: Creating and maintaining good SLIs takes time and a lot of effort and requires continuous monitoring and analysis.
❌Continuous Adaptation: SLIs must be examined and updated regularly to keep up with changing technology and user expectations.
📜 7. Service Level Agreement (SLA) – What happens if we break our promise?
A Service Level Agreement (SLA) is a formal contract between a service provider and a customer. It defines:
- The promised level of service (e.g., 99.99% uptime)
- What happens if the promise is broken (e.g., refunds or service credits)
- The metrics used to track performance (e.g., uptime %, response time)
SLAs ensure service providers stay accountable and maintain high reliability!
Like a restaurant promising “Your pizza will be delivered in 30 minutes or it’s free!”
In software terms, AWS offers an SLA of 99.99% uptime for its virtual machines (EC2 instances), which means only 4.38 minutes of downtime per month is allowed. However, due to a network failure, AWS’s EC2 service was down for 15 minutes this month.
Since the downtime exceeded the SLA limit, AWS offers service credits (discounts on future bills).
- Downtime between 4.38 – 20 minutes → 10% service credit
- Downtime over 20 minutes → 25% service credit
📝 SLA = Keeping Our Word (or Paying for It!)
✅ Advantage
✔ Clear Expectations: SLA sets clear, agreed performance levels, which are easier to monitor.
✔Legal Recourse: Based on mutual agreement (SLA), the client and vendor can sign the legal deal and decide the compensation and reward.
⚠️ Challenges
❌ Rigid Expectations: SLA might be too rigid that it can create a lot of pressure to meet those levels.
❌Penalties: If SLAs aren’t met, there can be financial penalties or other consequences.
⏳ 8. Recovery Time Objective (RTO) – How quickly must we recover?
RTO is the maximum downtime allowed before recovery. It defines how quickly a system or service must be restored to avoid major losses.
In the amusement park, one of the entry gates stopped working. To avoid long queues and frustrated clients, it should be fixed in 10 minutes.
So, the RTO for the entry gates of the amusement park is 10 minutes after which the visitors will feel frustrated and they have to move to other entry gates and need to wait longer in longer queues.
A database cluster with an RTO of 5 minutes means it must restart within 5 minutes after failure.
📝 Lower RTO = Faster Recovery = Less Downtime!
✅ Advantage
✔ Minimized Downtime and Financial Losses: Short RTO leads to less system downtime, which helps in lowering sales losses and operational costs and minimizing overall financial impact.
✔ Enhanced Customer Satisfaction and Reputation: Short RTO or lesser downtime helps maintain customer satisfaction and trust in the business.
⚠️ Challenges
❌Data Consistency Issues: Maintaining data consistency across different sites during recovery can be difficult and necessitates specific techniques.
❌ Cost: It can be costly to implement and maintain systems to achieve low RTOs, requiring a large investment in staff, equipment, and infrastructure.
🔄 9. Recovery Point Objective (RPO) – How much data loss is acceptable?
RPO measures how much data loss is acceptable in case of a failure. It determines how frequently data backups should be taken to minimize potential data loss.
The amusement park stores visitor transactions and ticket purchases in a database.
- If the RPO is 1 hour, the system backs up data every hour.
- If a failure happened at 3:59 PM, the last backup was at 3:00 PM, meaning up to 59 minutes of data could be lost.
- If RPO is 5 minutes, only 5 minutes of data would be lost in the worst case.
A banking system with an RPO of 0 seconds must never lose a transaction.
📝 Lower RPO = Less Data Loss! 🔄
✅ Advantage
✔Data Loss Control: This defines the level of data loss acceptance. This helps make informed decisions for money spent on data backup strategies.
✔Clear Impact Assessment: Using this metric enables businesses to understand the impact of data loss.
⚠️ Challenges
❌ Storage Requirements: To meet a short RPO, frequent backups and replication may increase storage costs and bandwidth needs.
❌ Latency: Data replication across a distributed system might affect application performance and data access speed.
🛠 Choosing the Right High-Availability Strategy: A Quick Guide!
Every business has different needs. Here’s a quick decision matrix:
| Strategy | Best for |
|---|---|
| 🔄 Redundancy | Critical services |
| ⚖️ Load Balancing | APIs, microservices |
| 📈 Auto-Scaling | Cloud-based apps |
| ❤️🩹 Failover Mechanisms | Business-critical services |
| 🗺️ Geographic Distribution | Global apps |
📊 High Availability Metrics at a Glance: A Quick Recap
Final Thought
High availability isn’t just about avoiding downtime—it’s about ensuring a seamless experience for every user, every time.
Because in today’s always-on world, your users don’t care if a part of your system is failing. They just expect it to work.
Is your system ready for that challenge?

This is a really helpful and well explained presentation